What is Slurm
Slurm1 is a workload manager for compute clusters. When you have multiple machines and multiple users that need to submit large jobs to them, you need a system that will queue the tasks, decide what to run where (based on required RAM, CPU, GPU and other constraints). In large shared systems, it takes care of accounting how many compute hours are assigned to each user.
Sounds similar to Kubernetes? It is, but they are designed for slightly different tasks. Slurm is made for batch jobs that usually do number-crunching for a few hours or days and save results to files. It’s the standard scheduler in academic and research HPC (High Performance Computing). K8s is made for long-running services. It scales the containers, monitors their health, routes traffic. In short, K8s can do Slurm’s job and sometimes it is used for HPC2, but Slurm cannot replace K8s for running web apps.
Why Slurm at home
Similar reason to everything in the Homelab section. I worked with Slurm before. I don’t use it day to day any more, and skills you don’t use have a habit of evaporating.
Running a small cluster
Real Slurm clusters are made of dozens or hundreds of powerful machines - which, obviously, I don’t have at home. Fortunately, I don’t need to run big jobs just to see how the cluster works. It’s possible to run Slurm using Docker containers for nodes. One docker compose up gives you a controller node, an accounting database, and a preset number of compute nodes which you can then scale up and down. I used a popular giovtorres/slurm-docker-cluster project.
Installing with Ansible
Same as everything else on my home servers, I used an Ansible role. A few of the more interesting parts:
The role clones the upstream repo at a pinned version, and generates the .env file that the docker-compose.yml reads its configuration from:
- name: Clone slurm-docker-cluster repo
  ansible.builtin.git:
    repo: "{{ slurm_cluster_repo }}"
    dest: "{{ slurm_cluster_root }}"
    version: "{{ slurm_cluster_version }}"

- name: Deploy slurm-docker-cluster .env
  ansible.builtin.template:
    src: env.j2
    dest: "{{ slurm_cluster_root }}/.env"
    owner: "{{ create_user }}"
    group: "{{ create_user }}"
    mode: '0600'
The .env template exposes the settings I need - worker count, GPU support, database credentials - as role defaults. Just in case I want to overwrite the settings using Ansible vars.
CPU_WORKER_COUNT={{ slurm_cluster_cpu_worker_count }}
GPU_ENABLE={{ slurm_cluster_gpu_enable | lower }}
{% if slurm_cluster_gpu_enable %}
GPU_WORKER_COUNT={{ slurm_cluster_gpu_worker_count }}
{% endif %}
One problem I found on a first attempt to start the cluster: the healthcheck for the MariaDB container (used for Slurm’s accounting data) gives up too quickly on a first-time init. Creating the database and user on my old CPU3 takes longer than the author expected. Rather than changing the compose file (which would get overwritten on the next clone), the role adds a docker-compose.override.yml that Docker Compose picks up automatically:
services:
  mysql:
    healthcheck:
      test: ["CMD", "healthcheck.sh", "--connect", "--innodb_initialized"]
      interval: 10s
      timeout: 10s
      retries: {{ slurm_cluster_mysql_healthcheck_retries }}
      start_period: {{ slurm_cluster_mysql_healthcheck_start_period }}
I set it to 120s with 5 retries - plenty of time even on weak hardware.
Monitoring Slurm
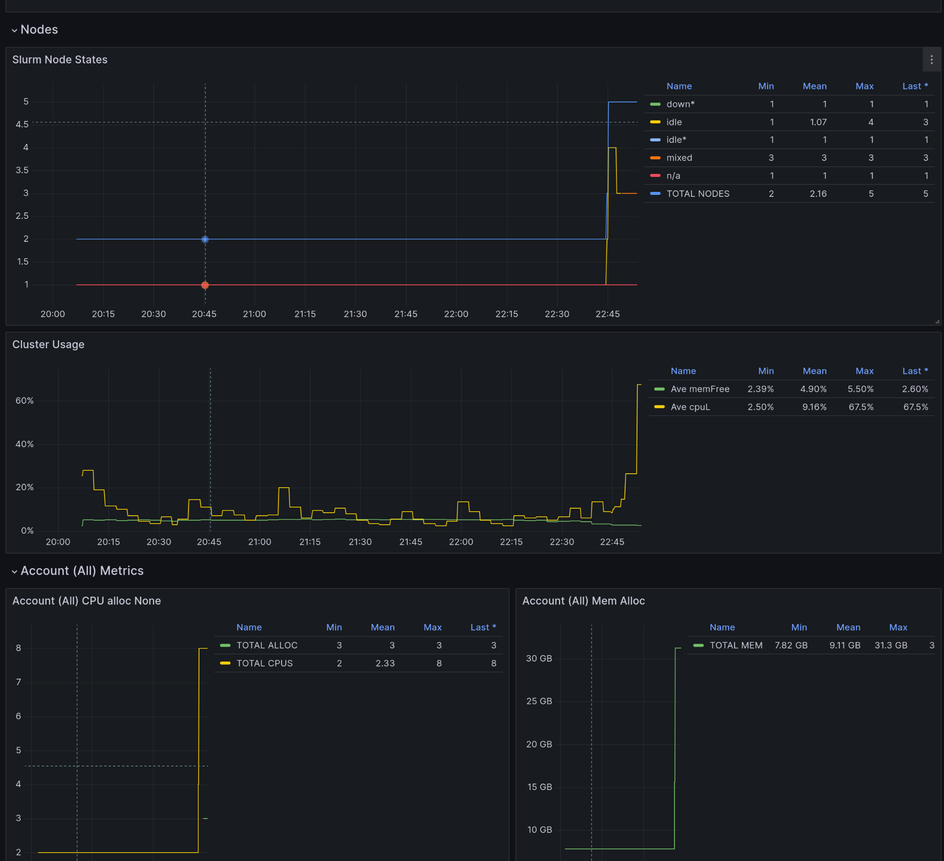
The same override file also adds another container - this one is from rivosinc/prometheus-slurm-exporter. The exporter runs Slurm commands such as sinfo and needs to access the munge authentication key. There’s an official dashboard that I imported on my Grafana.
Using the cluster
The wrapper script
I didn’t set the containers to autostart. My home servers have limited resources and I don’t want to run all my experimental projects at once. So the role’s last step is a thin wrapper script, deployed to /usr/local/bin, that just forwards to the project’s Makefile:
#!/bin/bash
set -euo pipefail
cd "{{ slurm_cluster_root }}"
exec make "$@"
Which turns into a simple command, e.g. slurm-cluster up. The possible parameters are:
up- start the clusterdown- stop without discarding the stateclean- stop and delete the volumes - accounting database, job spool etc.shell- exec a shell on the controller nodestatus- show container statuslogs/logs-slurmctld/logs-slurmdbd- container logs, all of them or just onejobs- view the job queue, without needing a shell firstquick-test/run-examples- submit a canned test job / a set of example jobsscale-cpu-workers N=5/scale-gpu-workers N=2- change the worker countreload-slurm- push a config reload without restarting the containersupdate-slurm FILES="slurm.conf"- copy updated config file(s) into the controller and reloadset-version VER=25.05.7- switch the Slurm version and rebuildbuild/build-all- build the image(s) locally instead of pullingrebuild- a sequence of: clean, build, up and status
Cluster info
Slurm commands are only available inside the containers, so I need to run slurm-cluster shell first. When I worked with a real cluster, one command I used all the time was sinfo. Usually, sinfo -lN for detailed node information. The STATE column was important:
idle- up, idlealloc- fully allocated to a jobmix- partially allocated (some CPUs free, some in use)down- unusabledrain- not accepting new jobs and idle, ready for maintenancedraining- not accepting new jobs, but waiting for the current job to finishunk- unknown, haven’t registered yet - often means the node is starting, if it’s stuck for too long it’s a reason to investigate
Plus a couple of suffixes worth recognising, although I haven’t seen them on the test cluster: * (not responding) and ~ (powered down).
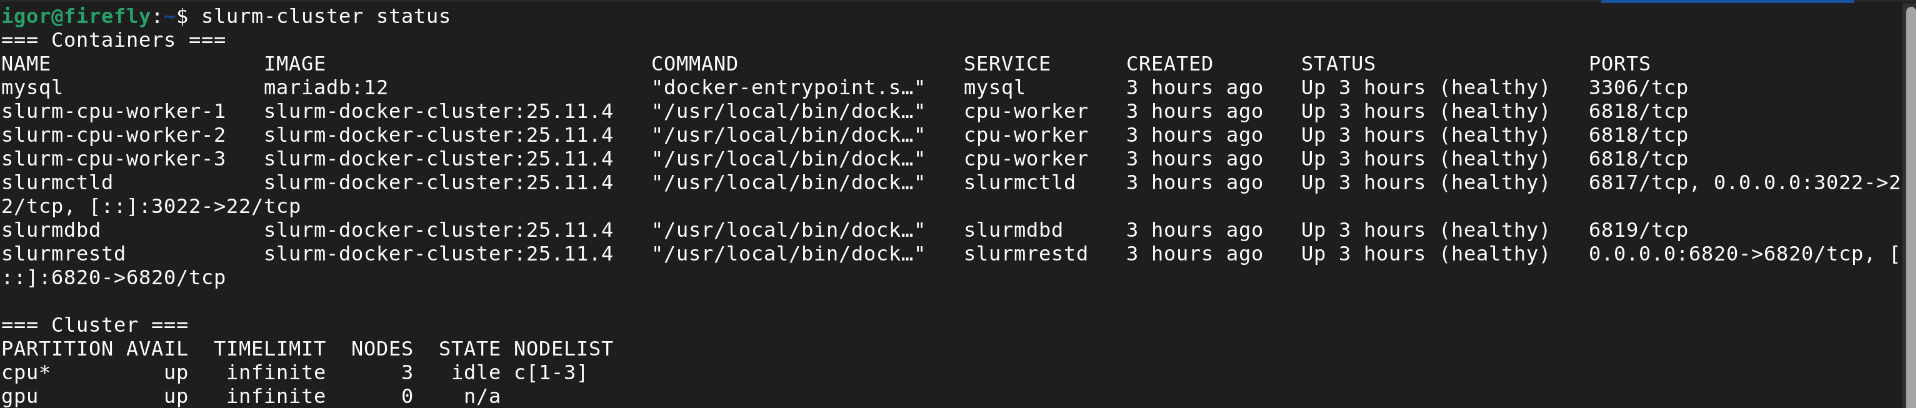
Outside of the container, slurm-cluster status gives combined output of docker compose ps and sinfo, good for a quick check.
First test
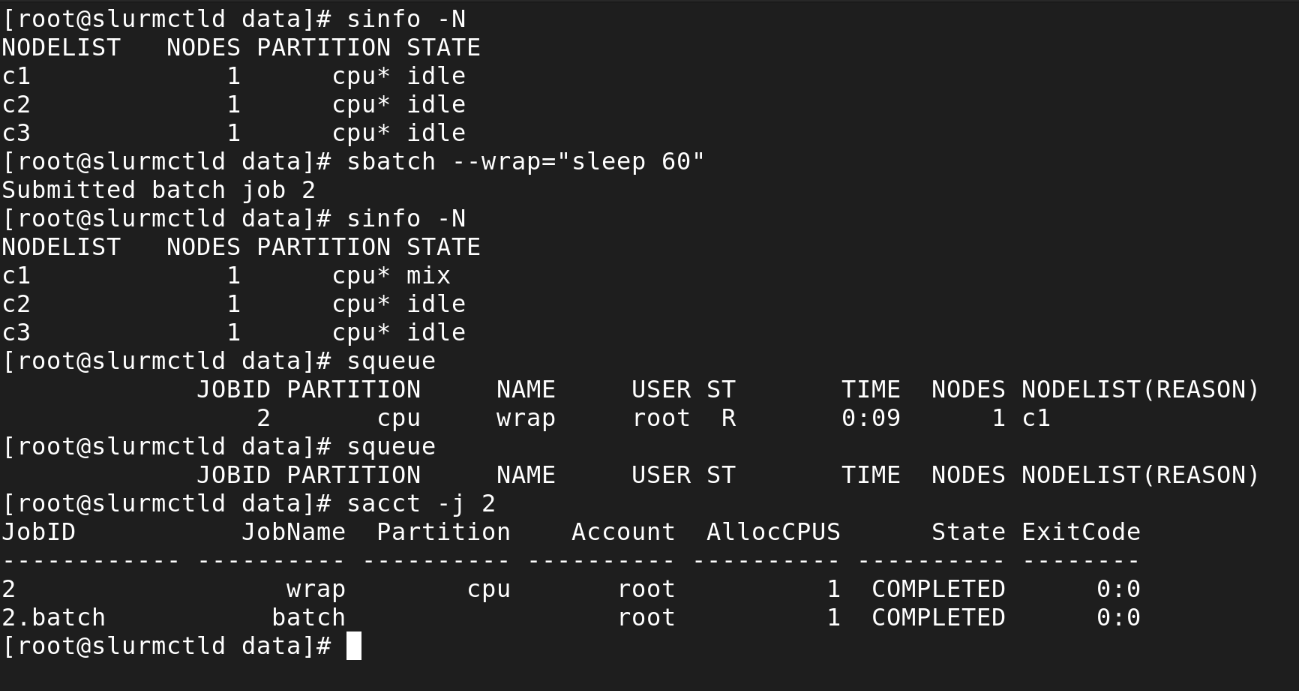
Submitting a trivial single-node job that just does nothing for a minute is a simple sbatch --wrap="sleep 60".
A “distributed” version is just a bit more complicated: sbatch -N3 --wrap="srun sleep 60". That’s because sbatch only runs the wrapped command on the first node of the allocation, -N3 reserves three nodes for the job, but doesn’t put the command on all of them. To actually get all three doing something, srun needs to launch it as a step inside the allocation.
In both cases, I could see the jobs starting in squeue and sacct -j 1, cancel with scancel -j 1 and watch nodes getting busy in sinfo.
A larger test
Now let’s try something that will cause a bit of CPU usage. It just happens I don’t have any number crunching to do! I have to simulate it. There’s Python on the Slurm containers. Python is notoriously slow for computation if you use native code and not compiled libraries like NumPy. I helped it by deliberately using an inefficient algorithm for finding prime numbers (it’s O(N²) - pretty bad, but I could do worse!). The script also prints the hostname, so I can see if it’s really running on all nodes.
#!/usr/bin/env python3
"""Deliberately inefficient CPU burn: trial-division primality test with no
shortcuts (checks every divisor up to n-1, not sqrt(n)), pure Python loop.
Prints progress so `squeue`/log output shows the job is alive on each node."""
import socket
import sys
import time


def is_prime_slow(n):
    if n < 2:
        return False
    divisor = 2
    while divisor < n:
        if n % divisor == 0:
            return False
        divisor += 1
    return True


def main():
    upper_bound = int(sys.argv[1]) if len(sys.argv) > 1 else 50000
    host = socket.gethostname()
    start = time.time()
    primes_found = 0
    for n in range(2, upper_bound + 1):
        if is_prime_slow(n):
            primes_found += 1
        if n % 2000 == 0:
            elapsed = time.time() - start
            print(f"[{host}] checked up to {n}/{upper_bound}, "
                  f"{primes_found} primes so far, {elapsed:.1f}s elapsed", flush=True)
    elapsed = time.time() - start
    print(f"[{host}] done: {primes_found} primes below {upper_bound} in {elapsed:.1f}s")


if __name__ == "__main__":
    main()
I’ll also use a “proper” way of submitting a job - an .sbatch file (which is just a shell script starting with some #SBATCH lines, ignored by shell but interpreted by Slurm).
#!/bin/bash
#SBATCH --job-name=cpu-burn
#SBATCH --nodes=3
#SBATCH --ntasks-per-node=1
#SBATCH --cpus-per-task=1
#SBATCH --time=00:15:00
#SBATCH --output=/data/cpu_burn_%j.out

# One task per allocated node; srun with no --ntasks picks up the
# allocation's node/task count automatically (3 nodes x 1 task each here).
srun python3 /data/cpu_burn.py "${1:-300000}"
First I need to copy both files into the controller node (which doubles as a login node in my small cluster - on real clusters, these are separate).
docker cp cpu_burn.py slurmctld:/data/cpu_burn.py
docker cp cpu_burn.sbatch slurmctld:/data/cpu_burn.sbatch
slurm-cluster shell
sbatch /data/cpu_burn.sbatch
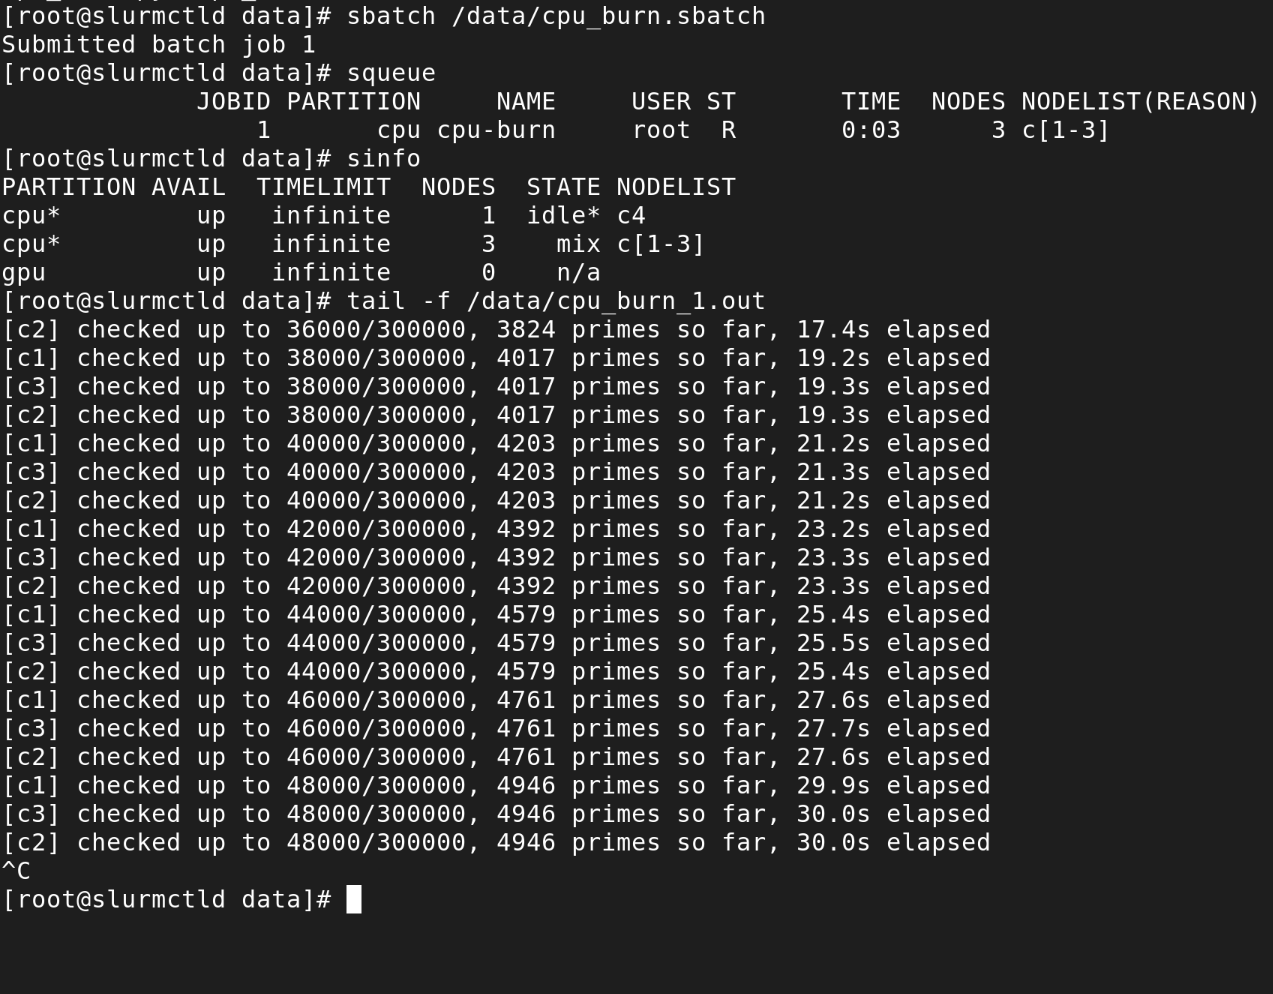
The result is as expected: mixed output from 3 scripts, CPU usage maxed, sinfo and squeue show all 3 nodes.
Differences compared to a real cluster
Other than the obvious difference in CPU, RAM and isolation between the “nodes” - the cluster running on Docker doesn’t have as many ways to fail. With a large enough cluster, you can expect regular problems: slurmd fails to start, node can’t authenticate to the controller, clock gets out of sync, GPU is not visible. Most of the problems in my experience weren’t really Slurm-specific, just regular sysadmin stuff such as low disk space or wrong file permissions. These things don’t happen on my experimental cluster, unless I intentionally break something.
As seen from the perspective of the controller node, the small cluster actually looks very much like a real thing. I can create partitions, set resource limits, run GPU jobs.
-
Initially, Simple Linux Utility for Resource Management. Now just Slurm, probably because it’s not so simple anymore. ↩︎
-
With some add-ons (e.g. Volcano or Kueue). Plain K8s misses a few things important for batch jobs, mainly gang scheduling (start all pods of a distributed job together or not at all, so you don’t deadlock with several half-ready jobs). ↩︎
-
I lied. Just a little bit. Slurm is running on Serenity now, but I actually used it long before setting up the homelab machine. It used to run on my NAS before. Probably the longer timeouts wouldn’t be needed now, but they don’t hurt either. ↩︎