For the reference, here are the default ports of various components of Prometheus/Grafana stack:
- 3000 Grafana
- 9090 Prometheus
- 9100 Prometheus Node Exporter
- 9116 Prometheus SNMP Exporter
- 9093 Prometheus Alertmanager
Generating node list for Prometheus
In the default config file there are already two exporters configured: Prometheus for localhost and node exporter also for localhost. Yes, Prometheus server also exposes some metrics about itself and then consumes them. The first item is OK, I only have one Prometheus instance, but I want to monitor all Linux hosts on my home network. Let's put the default config file in the role's templates subdirectory and add .j2 extension (so the full name is prometheus.yml.j2). Now just change a few lines at the end of the file:
  - job_name: node
    # If prometheus-node-exporter is installed, grab stats about the local
    # machine by default.
    static_configs:
      - targets:
      {% for host in groups['linux'] %}
        - '{{ host }}:9100'
      {% endfor %}
My Ansible inventory contains a group called linux, with all Ansible-managed Linux machines. Now, to generate the config file, change tasks/main.yml by adding these lines right after package installation:
- name: Generate config for Prometheus
  apt.builtin.template:
    dest: "/etc/prometheus/prometheus.yml"
    src: prometheus.yml.j2
  notify:
    - Restart Prometheus
We're now only missing the restart handler - a task that will run only when "Generate config for Prometheus" changes anything. Add handlers/main.yml:
---
- name: Restart Prometheus
  apt.builtin.service:
    name: "prometheus"
    state: restarted
Configuring Grafana
Grafana is a visual tool. You can programatically generate the config (it's all YAML) if you know what you want to achieve, but if you're exploring, GUI is a better option. Login to Grafana and click on "Add data source". Select "Prometheus" as type, then enter the hostname (either host.docker.internal or a real external hostname, localhost won't work) with port (9090 is the default). Select "No authentication" as we didn't configure any. Grafana will confirm it can read metrics from Prometheus.
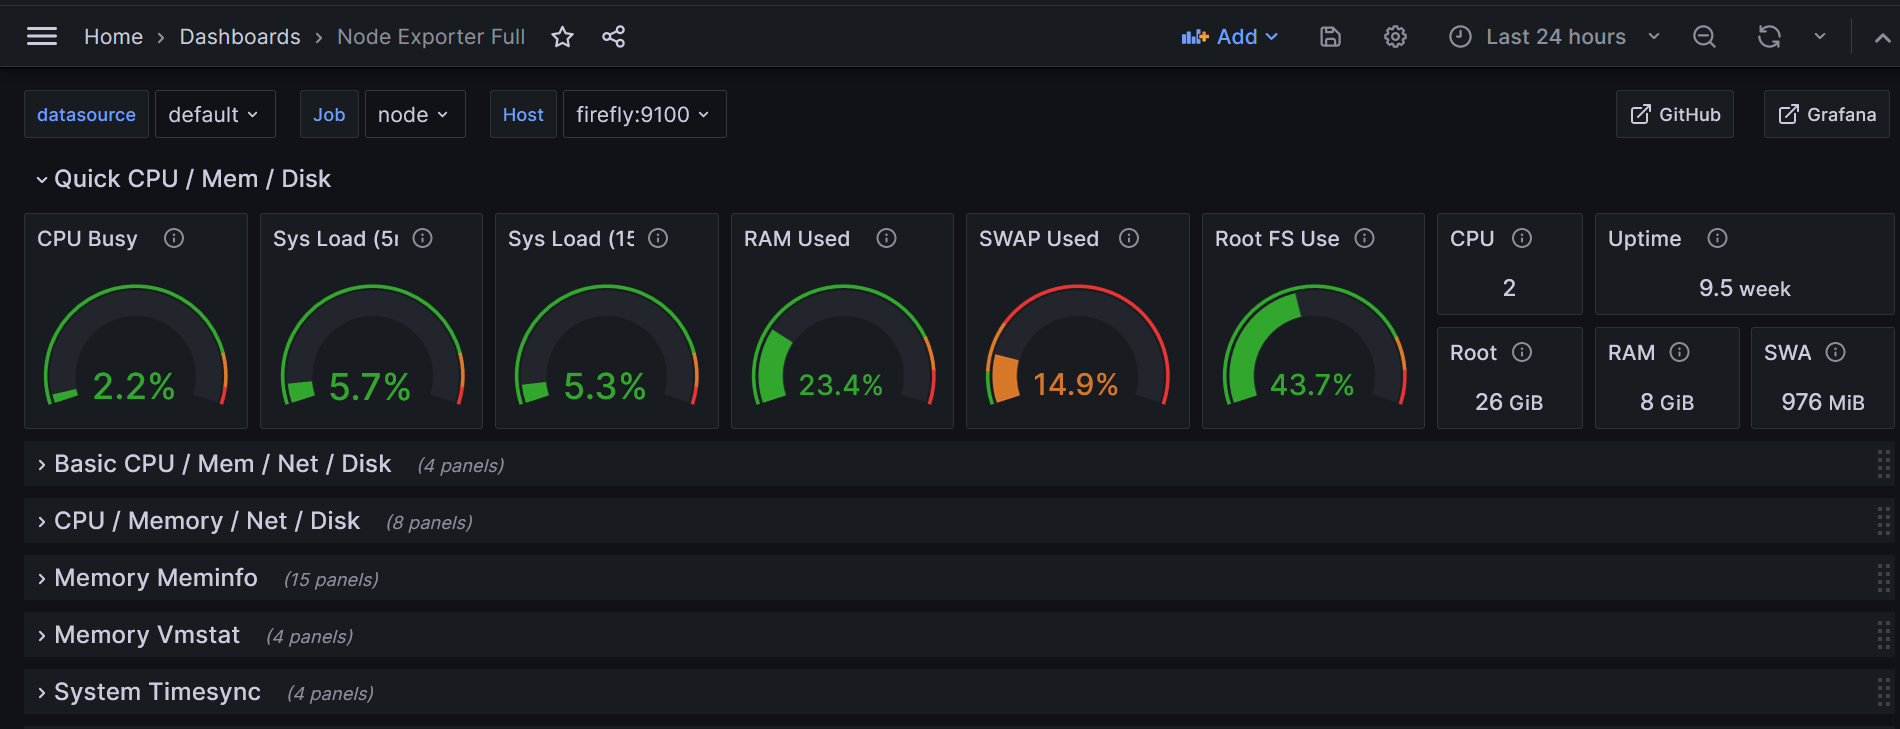
Let's get the graphs already. There are two options. You can create your own dashboard by manually adding graphs of various types and entering PromQL queries. Or you can import an existing dashboard from Grafana. The first way is useful if you need a custom dashboard to quickly see selected metrics from different sources. If you want a complete view of each node, importing a high-quality existing dashboard will save you hours. I chose "Node exporter full", template so famous that many template designers compare their work to it, referring it by id ("My template is similar to 1860, but...") and "Prometheus 2.0 Overview", number 3662.

Where to go from here
We barely scratched the surface. Prometheus is widely used for gathering all sort of metrics, from low-level system stats like we collect here, through HTTP/DB/other server stats, up to business metrics (eg. click through rate or order value from an e-commerce app) or industrial data. Grafana can plot all of these, plus it can use data sources other then Prometheus - next by popularity is probably Loki, a log aggregation system.
Then there's alerting. Is it useful for a home network? Definitely not as much as in the enterprise, some of your hosts may be down most of the time (eg. a laptop), but notification about low disk space on your NAS or a failed backup might be nice.