As the infrastructure grows, the need for monitoring becomes more appareant. Servers fail, and when they do, you want to be notified and you want to have information for debugging.
Every decent monitoring system is modular. It can gather metrics from a wide variety of hardware and software, it can discover new services in any environment (eg. LAN, Kubernetes, AWS), it can send alerts in many different ways, it can interface with a ticketing system. It can form a hierarchy, where low-level systems gather all data about their part of the infrastructure and send only summary statistics to the higher level. Most of these options are not needed at home, but it's still worth to choose one of the popular and comprehensive systems. First, because there's a high chance you'll use it later for your work. Second, because a popular monitoring system will likely have plugins for everything you might imagine. Some systems, despite being very advanced, are not particularly overwhelming - you can just focus on the core system and easily ignore the modules you're not using.
Choosing a monitoring software
Some of the popular monitoring systems are suprisingly old. Nagios, created in 2002, is still widely used - mostly because many admins find it already installed and working just fine. It has a huge library of community plugins, including very rare devices not available elsewhere, that's why many later monitoring systems can use Nagios plugins (with a varying amount of success).
Other somewhat popular and equally old (+/- 2 years) software include Zabbix, OpenNMS and Cacti. They have some strong points too, eg. Cacti makes it very easy to monitor network devices. But I wouldn't recommend any of these for a new installation. Infrastructure today is very different than in the early 2000s and we need to monitor containers, web services, ML platforms and other things that weren't even invented back then.
Why Prometheus
Prometheus was created in 2012, when cloud infrastructure was already similar to what we have today. It has all the standard features of a modern cloud-native software:
- all network communication is HTTP pull,
- written in Go,
- configuration in YAML,
- multiple independent instances can be used to reduce a risk of failure.
A data source for Prometheus is called exporter. There's a huge range of official exporters to choose from and even more written by the community, some popular ones include:
- node exporter, gives standard hardware and system statistics (CPU, memory, disk, load avg etc.) about a Linux host,
- SNMP exporter for monitoring network devices,
- exporters for server hardware, sensors, GPUs,
- exporters for HTTP servers and proxies which provide statistics such as latency, number of 4xx/5xx errors and many others,
- exporters for databases,
- exporters for cloud services (AWS, Azure, DigitalOcean, GitHub...)
Even better, Prometheus became so hugely popular that a lot of cloud infrastructure software (eg. Docker and Kubernetes) can directly expose metrics in a Prometheus format.
Prometheus collects metrics from the configured (or auto-discovered) exporters. Then it can use another module called AlertManager to notify about an urgent problem. An important feature is inhibition of alerts. Have you ever received hundreds of notifications when one network error caused many checks to fail? Prometheus can be configured to prevent that.
Prometheus has a web interface (obviously). You can use it to write ad-hoc queries against the stored metrics using PromQL, a specially designed and easy to learn query language. You can also view graphs, but it's not really recommended - Grafana, a visual dashboard which can get data from Prometheus, provides much better experience.
Installing Prometheus with Ansible
There are several ways to install Prometheus. You can use a package from your distribution, you can run it in a container or get the latest binary from the project's website. Debian and Ubuntu, my distros of choice, have Prometheus packages available. Of course, I'll use Ansible.
But wait, there will be only one Prometheus/Grafana server, but every Linux system in my home network should run a node exporter. I already have a role linux_common which, among other things, installs a few packages I like to have on all my machines. Let's add one thing to the list: sys_packages: [ 'curl', 'vim', 'git', 'screen', 'mc', 'lsof', 'aptitude', 'rsync', 'gpg', 'prometheus-node-exporter' ]
I'm going to run Prometheus on Firefly, my NAS. Not much choice, I only have two always-on systems: one for DNS/DHCP and one for everything else. But it might change in future, so I'll prepare a role "prometheus_server" and firefly will include this role.
First I'm installing packages: Prometheus core, alert manager, and SNMP exporter for monitoring network hardware.
- name: Install prometheus packages
  ansible.builtin.apt: name=['prometheus', 'prometheus-snmp-exporter', 'prometheus-alertmanager'] state=latest
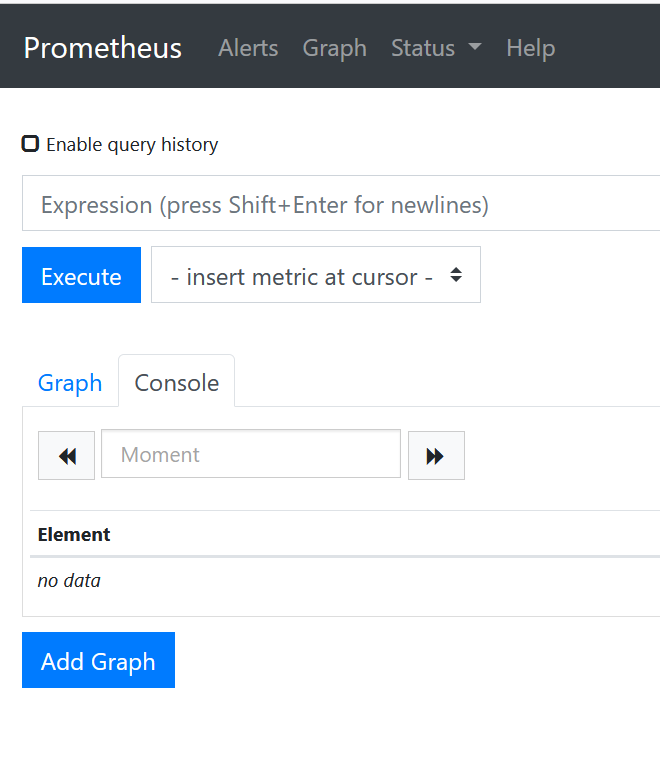
Let's point the browser to http://firefly.home.arpa:9090 - it works!

Installing Grafana with Ansible
Grafana is a bit more complex, as there's no official Debian package. I decided to use a Docker container. Here's a Docker Compose file:
version: '3.5'
services:
  grafana:
    image: grafana/grafana-oss:latest
    container_name: grafana
    environment:
      - TZ=Europe/London
    ports:
      - '3000:3000'
    extra_hosts:
      - "host.docker.internal:host-gateway"
    restart: 'always'
    volumes:
      - /data/noshare/grafana:/var/lib/grafana
This is fairly standard, except for extra_hosts directive. Grafana in a container wouldn't connect to Prometheus on the host. That is, it would connect with a real (not 127.0.0.1) IP, provided that Prometheus listens on something else then a loopback interface, treating it like any other external server. Usually, the whole point of using Docker is to have some isolation. But it's a home server, I'm OK with mixing container-based and host-based workloads. After adding those two lines we can connect from the container to services running on the host using a special name "host.docker.internal".
If we don't configure any volume, Grafana will store data inside the container - meaning it will lose it when the container is stopped. We can either create a Docker-managed volume, or bind-mount a specific directory. I chose the second option since I want to keep the data on a specific disk. Before we start the container, we need to make sure the directory exists and has proper access rights - Grafana runs as user with PID 472. Such user doesn't exist on my system, but that's not a problem. Here's how the complete Prometheus/Grafana role looks like:
---

- name: Install prometheus packages
  ansible.builtin.apt:
    name: ['prometheus', 'prometheus-snmp-exporter', 'prometheus-alertmanager']
    state: present

- name: Chown directory for Grafana data
  ansible.builtin.file:
    path: /data/noshare/grafana
    state: directory
    owner: 472
    recurse: true

- name: copy Grafana docker-compose.yml
  ansible.builtin.copy:
    src: files/docker-compose-grafana.yml
    dest: "/home/{{ create_user }}/compose/docker-compose-grafana.yml"
    owner: "{{ create_user }}"


- name: start containers
  community.docker.docker_compose:
    project_src: "/home/{{ create_user }}/compose/"
    state: present
    files:
      - "docker-compose-grafana.yml"
  register: result

- name: print compose output
  ansible.builtin.debug:
    var: result
    verbosity: 2
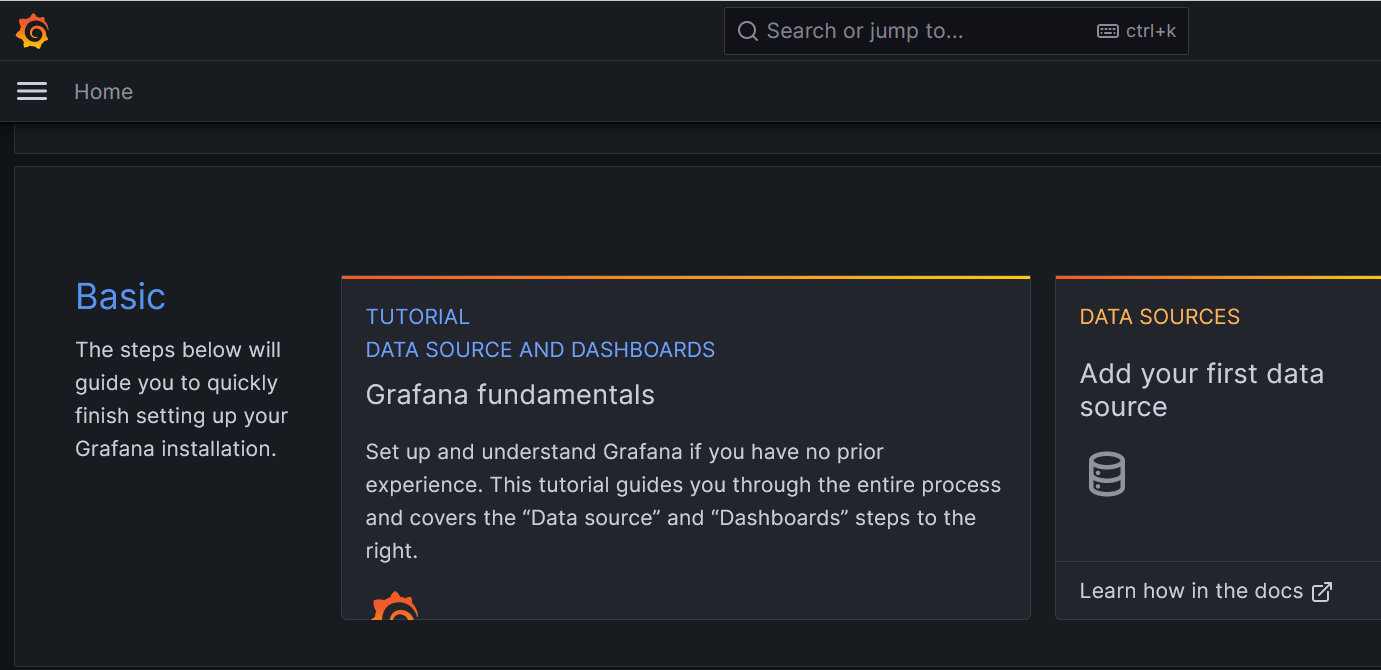
Run the playbook: ansible-playbook firefly.yml --start-at-task "Install prometheus packages" and check if the container is running: docker ps. Then, point the browser to http://firefly.home.arpa:3000 - if you don't see anything, wait a moment, Grafana needs to initialize its database on the first start.
