That is such a small improvement that it barely deserves a post. But here it is.
The Docker post ended with a small cheat sheet for reclaiming space. A usual docker system df does the job, as long as you remember to run it and look at the results. My NAS firefly is a relatively stable environment, but on a homelab machine serenity I experiment with new software, run different versions etc. I thought it would be nice to have a quick look at what’s using the space and installed Doku.
Alternatives
There is no shortage of web UIs for Docker. If you already use them for other reasons, you might not need a separate dashboard.
- Portainer - the most famous one. It manages everything around Docker, supports multi-host setups and can even do app deployment and templates. Disk usage charts are available, but are spread between the views (volumes, images).
- Isaiah - lazydocker in the browser (looks a lot like a terminal app). Also manages all aspects of Docker, but without app deployment. Lighter than Portainer and disk usage charts are more convenient.
- and Doku - does nothing except visualise Docker disk usage.
| Doku | Isaiah | Portainer | |
|---|---|---|---|
| Disk usage charts | the only thing | good panel | OK, but not great |
| Cleanup actions | no | yes | yes |
| General Docker management | no | yes | yes |
| App deployment | no | no | yes |
Why Doku
I picked Doku precisely because it only does disk usage.
In Portainer and Isaiah you’re not only viewing disk usage - you can also delete the offending resources. It’s convenient, but it comes with a price: a UI that can manage Docker needs read-write access to the Docker socket. That’s a huge attack surface that I don’t want to open without a good reason, and viewing charts isn’t one. Sure, it’s not much difference on a home system behind NAT, but I’d like to keep good practices.
Doku only reads, so the socket is mounted read-only. If it’s compromised, the only risk is leaking info on what software I use. That’s orders of magnitude less risky than ability to run arbitrary software with full privileges - which is what full-featured Docker dashboards do. If it means I need to use a terminal to actually delete images, it’s no big deal.
And the other management functions, starting/stopping containers, deploying apps? I don’t even want them. I use Docker Compose files, plus Ansible playbooks for my “production” machine (I’m less strict about the homelab server). Another way of doing the same thing leads to configuration drift.
Installing it
I use an Ansible role to install Docker, so I simply added the tasks at the end of it.
Ansible generates the compose file from a template, since some details are different between my 2 docker hosts.
# {{ ansible_managed }}
version: '3.5'
services:
  doku:
    image: {{ docker_host_doku_image }}
    container_name: doku
    restart: always
    environment:
      # Default is 9090, which is taken by Prometheus on our docker hosts.
      - PORT={{ docker_host_doku_port }}
    ports:
      - "{{ docker_host_doku_port }}:{{ docker_host_doku_port }}"
    volumes:
      - /var/run/docker.sock:/var/run/docker.sock:ro
      - {{ docker_host_data_root }}:{{ docker_host_data_root }}:ro
      - {{ docker_host_containerd_root }}:{{ docker_host_containerd_root }}:ro
The mounts are :ro. The port is remapped because both Doku and Prometheus listen on 9090 by default.
Security considerations
Filesystem access
Doku recommends a slightly different volume setup: -v /:/hostroot:ro. That is, mounting the whole host’s filesystem. Still read-only, but there’s no way I’m giving it access to all my files. A disk space dashboard shouldn’t need it.
Unfortunately, it needs it for some functions - but they’re not crucial. I only mounted Docker’s and Containerd’s data root (that would be /var/lib/docker and /var/lib/containerd by default, but I moved them to a larger drive - hence the variables).
What doesn’t work is Overlay2 sizes - normally, it’s very nice, with per-layer breakdown. And if I bind-mount anything from a different path, it won’t show up. Everything else works just fine.
Network access
Doku traffic is unencrypted and unauthenticated by default. I left it like this, cause I only expose it on the home LAN.
It can do HTTP basic auth and TLS. It would only take a few extra lines in the Compose file, though if you want to use LetsEncrypt or another renewal service, you need to script it yourself.
For a bigger deployment (e.g. in the datacentre) I would rather have a reverse proxy in front of it, to handle authentication, encryption and WAF.
Using it
There’s not much to explain. I can go to http://firefly:9096 or http://serenity:9096
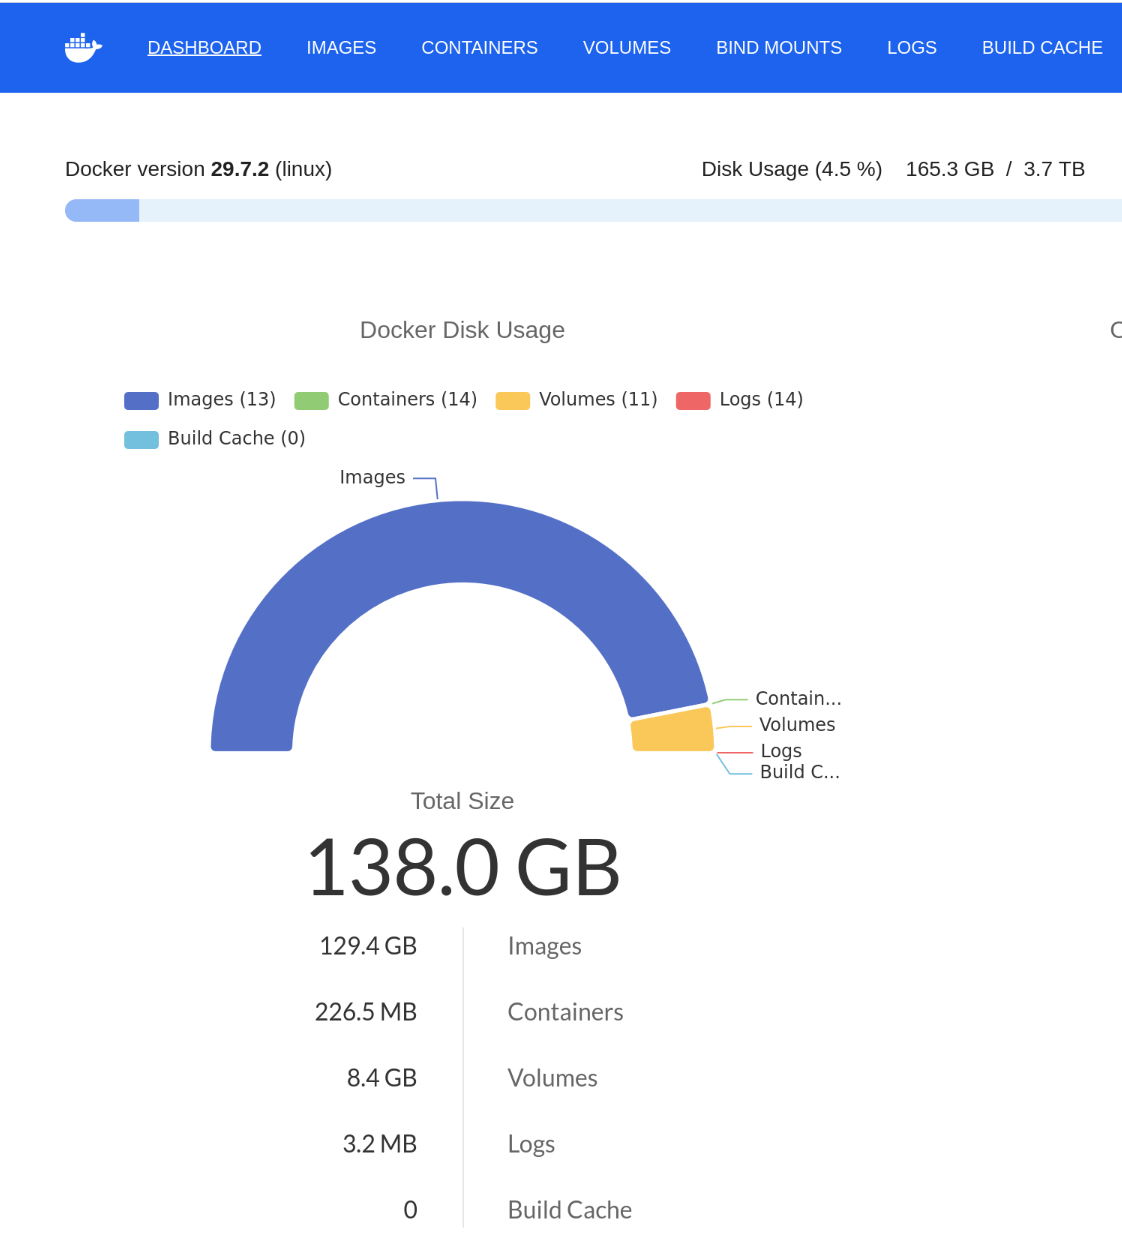
and there it is: main page shows total usage and breakdown by type.
Then I can go to images, containers, volumes, build cache etc. It lists the resources of the type, sorted from the largest by default. I could immediately see what’s wasting my disk space.
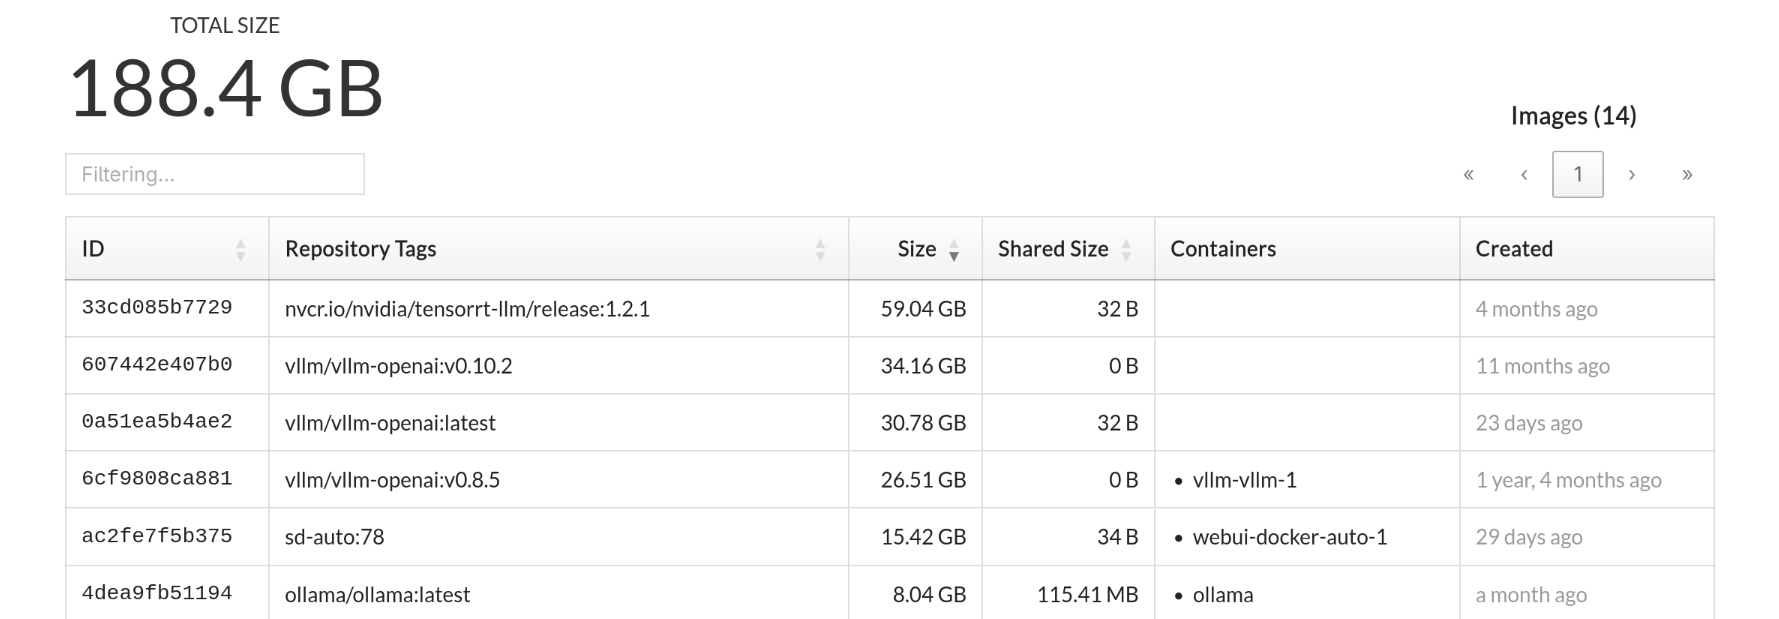
Exactly what I wanted. Doku rescans the data directory on an interval. Even on my limited hardware it’s barely noticeable.